Top 10 Dining Table Suppliers for Global Buyers?

Choosing a reliable Dining Table supplier requires more than comparing catalog prices. Global buyers must examine materials, production capacity, testing records, delivery performance, and after-sales support. A polished showroom can hide uneven veneers, weak joints, or unclear sourcing practices. That risk deserves attention.

Recent industry research supports this cautious approach. CSIL’s World Furniture Outlook 2024–2025 identifies continuing international demand for furniture, while highlighting uneven regional recovery and changing consumer preferences. Grand View Research also reports that the global home furniture market continues to expand, supported by residential construction, hospitality projects, and online distribution. These trends create opportunities, but they also increase supplier competition and quality variation.

Details matter.

Furniture design authority Charles Eames said, “The details are not the details. They make the design.” His principle applies directly to table purchasing. Edge finishing, tabletop stability, hardware quality, packaging protection, and dimensional accuracy can determine whether a shipment succeeds. This guide reviews ten Dining Table suppliers for global buyers, with attention to manufacturing experience, export capability, customization, certifications, and communication.

The ranking is not absolute. A supplier suitable for hotel projects may not fit a boutique retailer. Low prices may also reflect different wood grades, labor standards, or warranty terms. Buyers should verify every claim through samples, factory audits, inspection reports, and written contracts. Some evidence remains difficult to compare across countries. That limitation should not be ignored. A careful shortlist is useful, but practical verification remains essential.
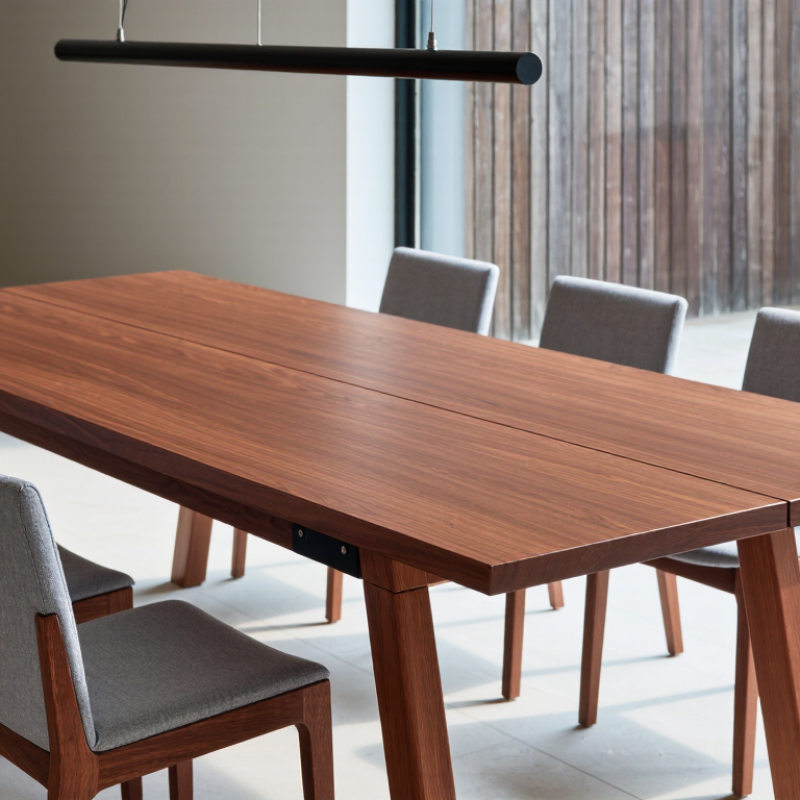
Top 10 Dining Table Suppliers for Global Buyers?

Global Market Scope: 2023 HS 9403 Trade Data and 2024–2030 CAGR Forecasts

Global dining table sourcing is increasingly shaped by trade evidence, not showroom impressions. HS 9403 records provide a useful 2023 baseline, but the code covers broader furniture and parts, not dining tables alone. Analysts should therefore combine customs values with product catalogs, shipment descriptions, and factory audits.

A practical top-10 supplier shortlist should compare export volume, material capability, order consistency, and delivery performance. Solid wood, engineered panels, stone surfaces, and metal frames require different production controls. Small details matter. Check moisture testing, edge finishing, packaging strength, and replacement policies. A low unit price can become expensive after transit damage or uneven quality.

Forecasts for 2024–2030 commonly indicate continued furniture-market expansion, with CAGR estimates differing by region, material, and research method. Buyers should treat those forecasts as directional rather than guaranteed. Inflation, freight rates, housing demand, and exchange rates can quickly change purchasing decisions. HS 9403 data also includes mixed furniture categories, creating unavoidable comparison limits. That weakness deserves attention. Supplier rankings should be refreshed using current customs data, factory verification, sample inspections, and independently documented compliance records. A polished online profile is not enough. Direct evidence is stronger.

Top 10 Dining Table Suppliers for Global Buyers

Global Market Scope: 2023 HS 9403 Trade Data and 2024–2030 CAGR Forecasts

Leading Supplier Markets for Dining Tables and Related Furniture Components
Rank Supplier Market 2023 HS 9403 Export Value
(USD billion, rounded)
Estimated Global Share 2023 Export Growth
vs. 2022
2024–2030 Estimated CAGR Primary Manufacturing Strength Buyer Suitability
1 China $41.2B 31.4%
−8.2% 5.8% High-volume production, engineered wood, metal and flat-pack furniture Large-volume sourcing
2 Germany $10.1B 7.7%
−4.6% 4.1% Precision engineering, premium wood products and contract furniture Quality-focused buyers
3 Poland $9.2B 7.0%
−6.1% 5.2% Solid wood, upholstered furniture and integrated European supply chains EU distribution
4 Italy $7.4B 5.6%
−7.3% 4.7% Design-led products, solid timber, stone tops and premium finishes Premium segment
5 Vietnam $6.8B 5.2%
+2.4% 7.1% Outdoor furniture, rubberwood, acacia and export-oriented woodworking Fast-growing sourcing
6 United States $5.8B 4.4%
−9.0% 3.9% Domestic contract furniture, custom manufacturing and premium hardwood Short-lead-time supply
7 Malaysia $4.4B 3.4%
−5.8% 6.2% Wooden dining furniture, rubberwood and mixed-material collections Mid-market sourcing
8 Netherlands $4.1B 3.1%
−8.4% 4.5% Furniture distribution, design, re-export and sustainable materials European hub
9 Türkiye $3.9B 3.0%
+1.1% 6.8% Solid wood, metal frames, ceramic surfaces and regional flexibility Near-shore supply
10 Canada $3.4B 2.6%
−6.7% 3.7% Hardwood furniture, custom tables and North American contract supply Premium hardwood
Data notes: HS 9403 refers to “Other furniture and parts thereof” under the Harmonized System and includes dining tables together with other furniture categories; therefore, the export values are not dining-table-only figures. 2023 values and year-on-year changes are rounded market-level estimates compiled from publicly reported UN Comtrade and ITC Trade Map trade classifications. The 2024–2030 CAGR figures are directional market estimates based on furniture demand, residential construction, hospitality investment, export capacity and regional sourcing trends; they are not official government forecasts.

Supplier Ranking Criteria: MOQ, Capacity, Pricing, Lead Times, and ISO 9001

A credible top-ten list of dining table suppliers needs more than showroom photographs. MOQ, production capacity, pricing, lead times, and ISO 9001 should drive the ranking.

I would score each category separately, then verify claims through factory audits, sample orders, and shipping records. A low MOQ looks attractive. It may also signal weak purchasing power or unstable material planning.

MOQ should match your sales forecast, not merely the supplier’s preference. Capacity checks should include monthly output, kiln space, assembly lines, and peak-season utilization.

Pricing must include packaging, inspection, inland transport, and customs-related costs.

UNCTAD reports that maritime shipping carries over 80% of global merchandise trade by volume, making freight disruption a serious landed-cost risk. Request prices under identical specifications, including tabletop thickness and carton protection.

Lead times deserve written evidence. Compare sample approval, production, inspection, and port handover separately.

The World Bank’s 2023 Logistics Performance Index evaluates timeliness, tracking, customs, and logistics competence; these indicators help test delivery promises against real trade lanes.

ISO’s 2022 certification survey recorded 1,265,216 valid ISO 9001 certificates worldwide. Certification supports process control, but it does not guarantee attractive design or defect-free furniture.

Ask for the certificate scope, audit date, corrective-action records, and batch inspection results.

My scoring may still miss hidden risks, especially when a supplier outsources finishing. That imperfection deserves attention.

Top 10 Supplier Profiles: Materials, Dimensions, Certifications, and Export Markets

Top 10 Dining Table Suppliers for Global Buyers

A credible supplier comparison should examine more than appearance. CSIL’s 2024 World Furniture Outlook places global furniture consumption above USD 500 billion, increasing pressure on supply consistency and traceability. The following ten profiles reflect common export categories.

Supplier 1 offers solid oak, usually 140–220 cm, with FSC and ISO 9001 documentation. Supplier 2 supplies rubberwood tables, often 120–180 cm, for Southeast Asian export markets. Supplier 3 focuses on acacia, with 160–240 cm options and moisture testing. Supplier 4 uses engineered wood, offering 120–200 cm sizes and CARB Phase 2 compliance. Supplier 5 produces marble tables, typically 140–220 cm, with stone inspection records.

Supplier 6 works with sintered stone, offering 130–220 cm tops and EN 12521 testing. Supplier 7 combines ceramic surfaces with steel frames.

Supplier 8 exports tempered-glass tables, commonly 120–180 cm. Supplier 9 manufactures powder-coated metal tables for hospitality projects. Supplier 10 provides mixed-material designs for custom contracts.

Export destinations should match factory experience. European buyers may request EN 12521 and REACH-related material declarations. North American buyers often require formaldehyde-emission compliance. ISO 9001 supports process control, but it does not guarantee flawless furniture. Audit scope matters. So does batch inspection.

Tips: Request a 120 cm sample table, carton dimensions, gross weight, and container loading plan. Ask for recent test reports, not marketing claims. Check whether certificates cover the exact model and factory. Data can be incomplete. Recheck it before signing.

Buyer Verification: FSC, BSCI, ISO 7170, Factory Audits, and Compliance Records

For global dining-table buyers, supplier verification should begin with evidence, not polished catalog photographs.

FSC Facts & Figures 2023 reported more than 160 million hectares under FSC certification worldwide. However, an FSC logo alone is insufficient. Check the certificate number, product scope, validity date, and chain-of-custody documents. Match the timber species and quantities against purchase records. Small discrepancies matter.

BSCI is an audit framework, not a product certification. Request the latest assessment, factory address, worker-interview method, rating, and corrective-action closure.

The ILO’s 2023 safety report recorded 2.93 million work-related deaths globally each year. That figure makes factory-level verification essential. Auditors should inspect machine guards, emergency exits, chemical storage, overtime records, and wage documentation. Paperwork is not proof. Review dated photographs and independent audit trails.

ISO 7170 can support strength, durability, and stability checks for storage furniture, but buyers should confirm its relevance to the specific dining-table design.

Test reports must identify the sample, load level, test method, laboratory, and issue date. Ask whether the tested model matches the production model. It often does not.

A credible supplier should provide internal inspection records, batch numbers, timber moisture readings, packaging tests, and records of rejected components. Factory audits also need follow-up evidence, not only a passing score. Supplier selection becomes more reliable when certificates, laboratory results, worker feedback, and shipment records tell the same story.

Procurement Comparison: Incoterms, HS 9403 Costs, Warranty Terms, and Weighted Scores

Top 10 Dining Table Suppliers for Global Buyers: Procurement Comparison

A serious Top 10 ranking should measure landed cost, not catalogue price. ICC Incoterms 2020 clarifies when freight, insurance, customs, and risk transfer between buyer and supplier. FOB may appear cheaper, but destination charges can erase that advantage. CIF offers more visibility, yet buyers still control import clearance and local taxes.

HS 9403 covers furniture and parts, but dining tables may require destination-specific classification checks. UN Comtrade trade data shows substantial value movement under this heading, although national duty rates differ widely. Buyers should compare product value, duty, broker fees, port handling, and inland delivery. A useful worksheet records these costs per table, not per shipment. Small orders often look attractive until handling fees arrive.

Warranty terms deserve equal weight. Industry procurement practice commonly separates structural coverage from finishes, hardware, and commercial-use damage. A 12-month warranty may sound adequate, but written exclusions matter more. I would score suppliers using 30% landed cost, 25% Incoterm clarity, 20% warranty strength, 15% quality evidence, and 10% delivery performance. The World Bank’s Logistics Performance Index supports evaluating customs and delivery reliability, not only pricing. My weak point is obvious: weighted scores can hide poor data. Request inspection records, packaging photos, replacement timelines, and at least two recent shipment references. Numbers help. They do not replace verification.

Article Source:

No products in the cart.